LIDA
Automatic data exploration and visualisation generation.
About LIDA
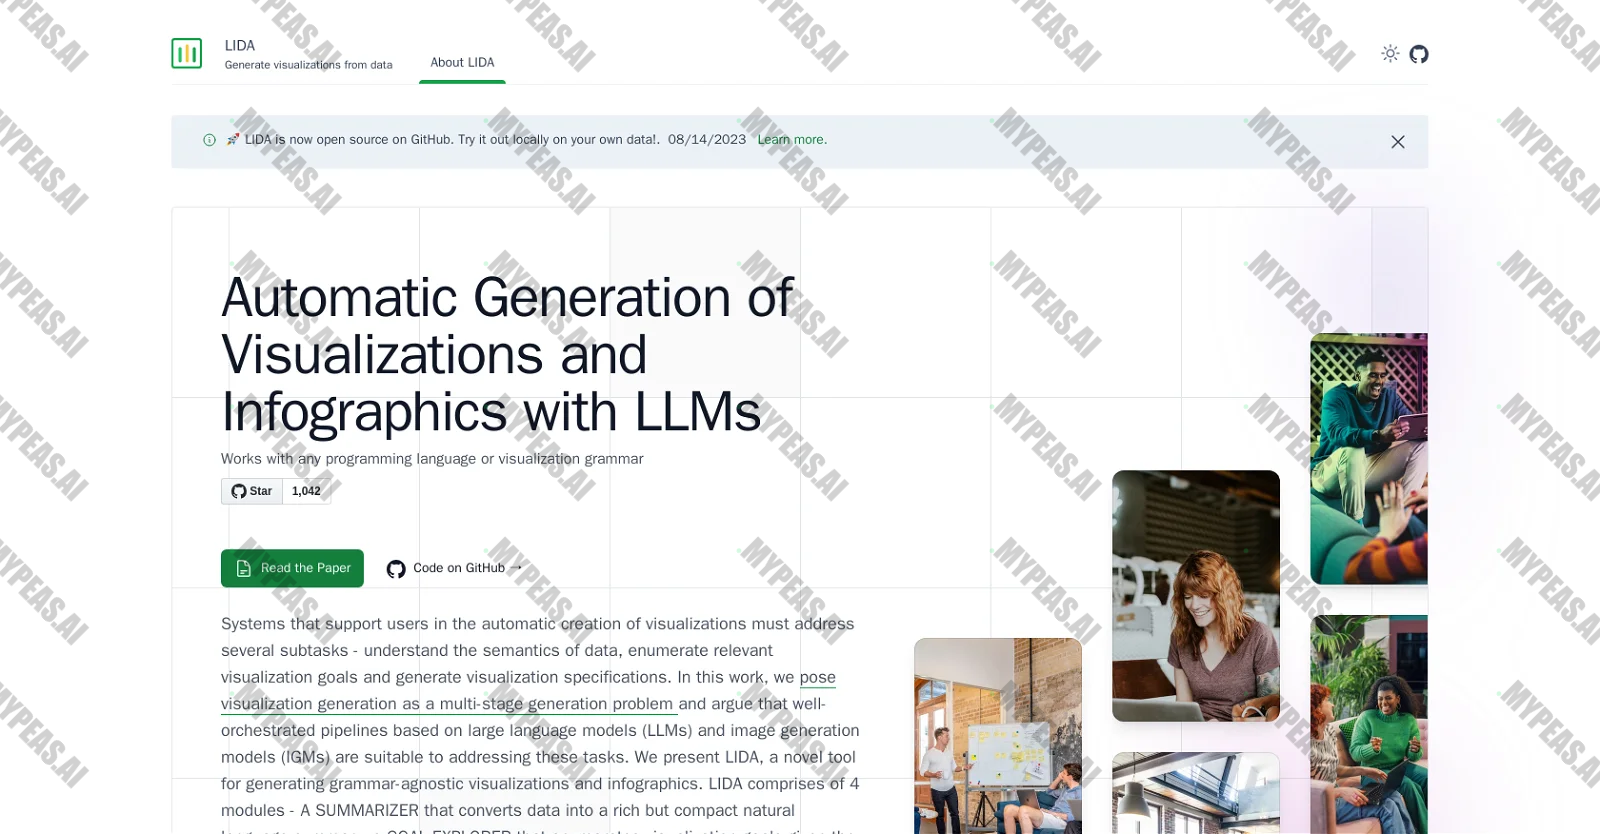
LIDA is a cutting-edge tool designed to streamline data exploration by harnessing the power of large language models (LLMs) like ChatGPT and GPT4 to create visualizations and infographics.
With a user-friendly conversational interface, LIDA automates the generation of grammar-agnostic visualizations from raw data. Its four key modules - the Summarizer, Goal Explorer, VisGenerator, and Infographer - work in harmony to transform data into concise natural language summaries, identify visualization goals, generate visualization code, and produce stunning graphics.
Compatible with various programming languages and visualization grammars such as Python (e.g., Altair, Matplotlib, Seaborn), R, and C++, LIDA offers a wide range of capabilities including data summarization, automated data exploration, and infographics generation.
By leveraging the advanced capabilities of LLMs and image generation models (IGMs), LIDA tackles the complexities of visualization creation through multi-stage generation. Its open-source nature, Python API, and hybrid user interface make it a versatile tool for interactive chart, infographic, and data story creation.
While LIDA may have limitations with certain visualization grammars and performance variations based on library choices, it remains a powerful solution for automating the visualization generation process.










Track the Impact of Your AI Usage
Document your productivity gains and build your AI portfolio for performance reviews
Start Tracking Free